
Moving Average Convergence Divergence (MACD) compares a fast exponential moving average of closing prices with a slow exponential moving average. Its signal line smooths that difference; its histogram shows the gap between the MACD line and the signal line.
What the MACD measures
The examples use a fast EMA of 12 bars, a slow EMA of 26 bars and a signal EMA of 9 bars, applied to close prices. These are the classic defaults, not optimized recommendations.
- The MACD line is the fast EMA minus the slow EMA.
- The signal line is an EMA of the MACD line.
- The histogram is the MACD line minus the signal line.
The calculation used by this download
MACD[i] = EMA(close, FastEma)[i] - EMA(close, SlowEma)[i]
Signal[i] = EMA(MACD, SignalEma)[i]
Histogram[i] = MACD[i] - Signal[i]
alpha = 2 / (N + 1)
EMA[i] = EMA[i-1] + alpha * (x[i] - EMA[i-1])
Seeds and warm-up
Each EMA starts with the simple mean of its first N input values. The fast and slow price EMAs start at their respective seed bars; the signal EMA starts from the first SignalEma available MACD values. Indexing runs from the oldest bar. With sufficient history, the first MACD index is SlowEma − 1 and the first signal and histogram index is SlowEma + SignalEma − 2. Earlier values are empty. With insufficient history, all buffers remain empty and the next call recalculates from scratch.
The seed mean is computed as the first value plus the mean of the differences to it. This is the same simple mean and keeps a run of identical values exact. An EMA with N = 1 is the input itself.
How crossings are defined
A bullish signal-line crossing occurs when the MACD line moves from below its signal line to above it. A bearish crossing is the reverse. Equivalently, the histogram changes sign. A zero-line crossing instead occurs when the MACD line itself changes sign.
Above and below are strict comparisons. An exact zero keeps the previous side: a touch without a sign change is not a crossing. A crossing through an exact zero is reported on the first bar strictly on the new side. The first bar with a side has nothing to cross from.
A crossing describes past bars; it does not forecast prices.
Crossings are reported at the closing bar where the sign change becomes visible, never back-dated. The newest bar may still be forming and does not confirm a crossing. Its MACD, signal and histogram values recalculate on each tick. A closed-bar event is not removed or moved while the closed history is unchanged; a history reload recalculates the indicator from the new data.
Reading the chart examples
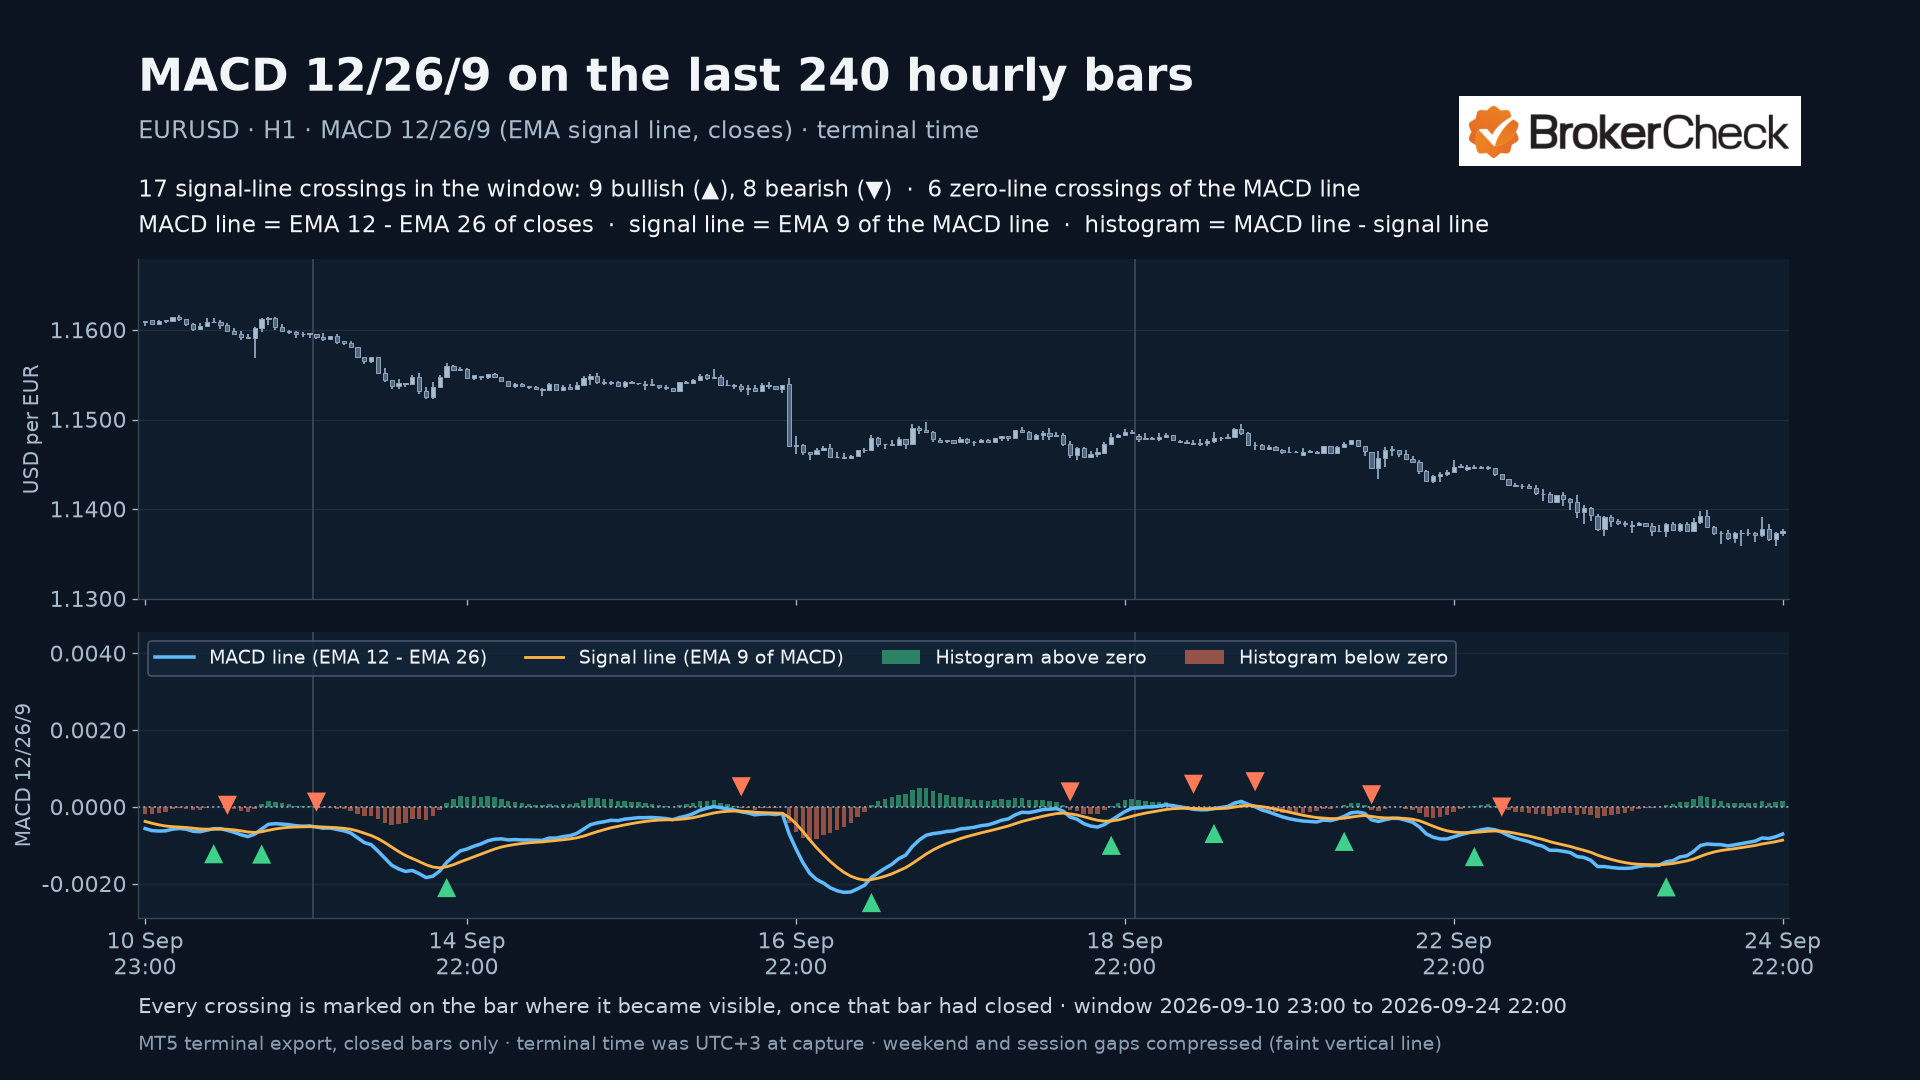
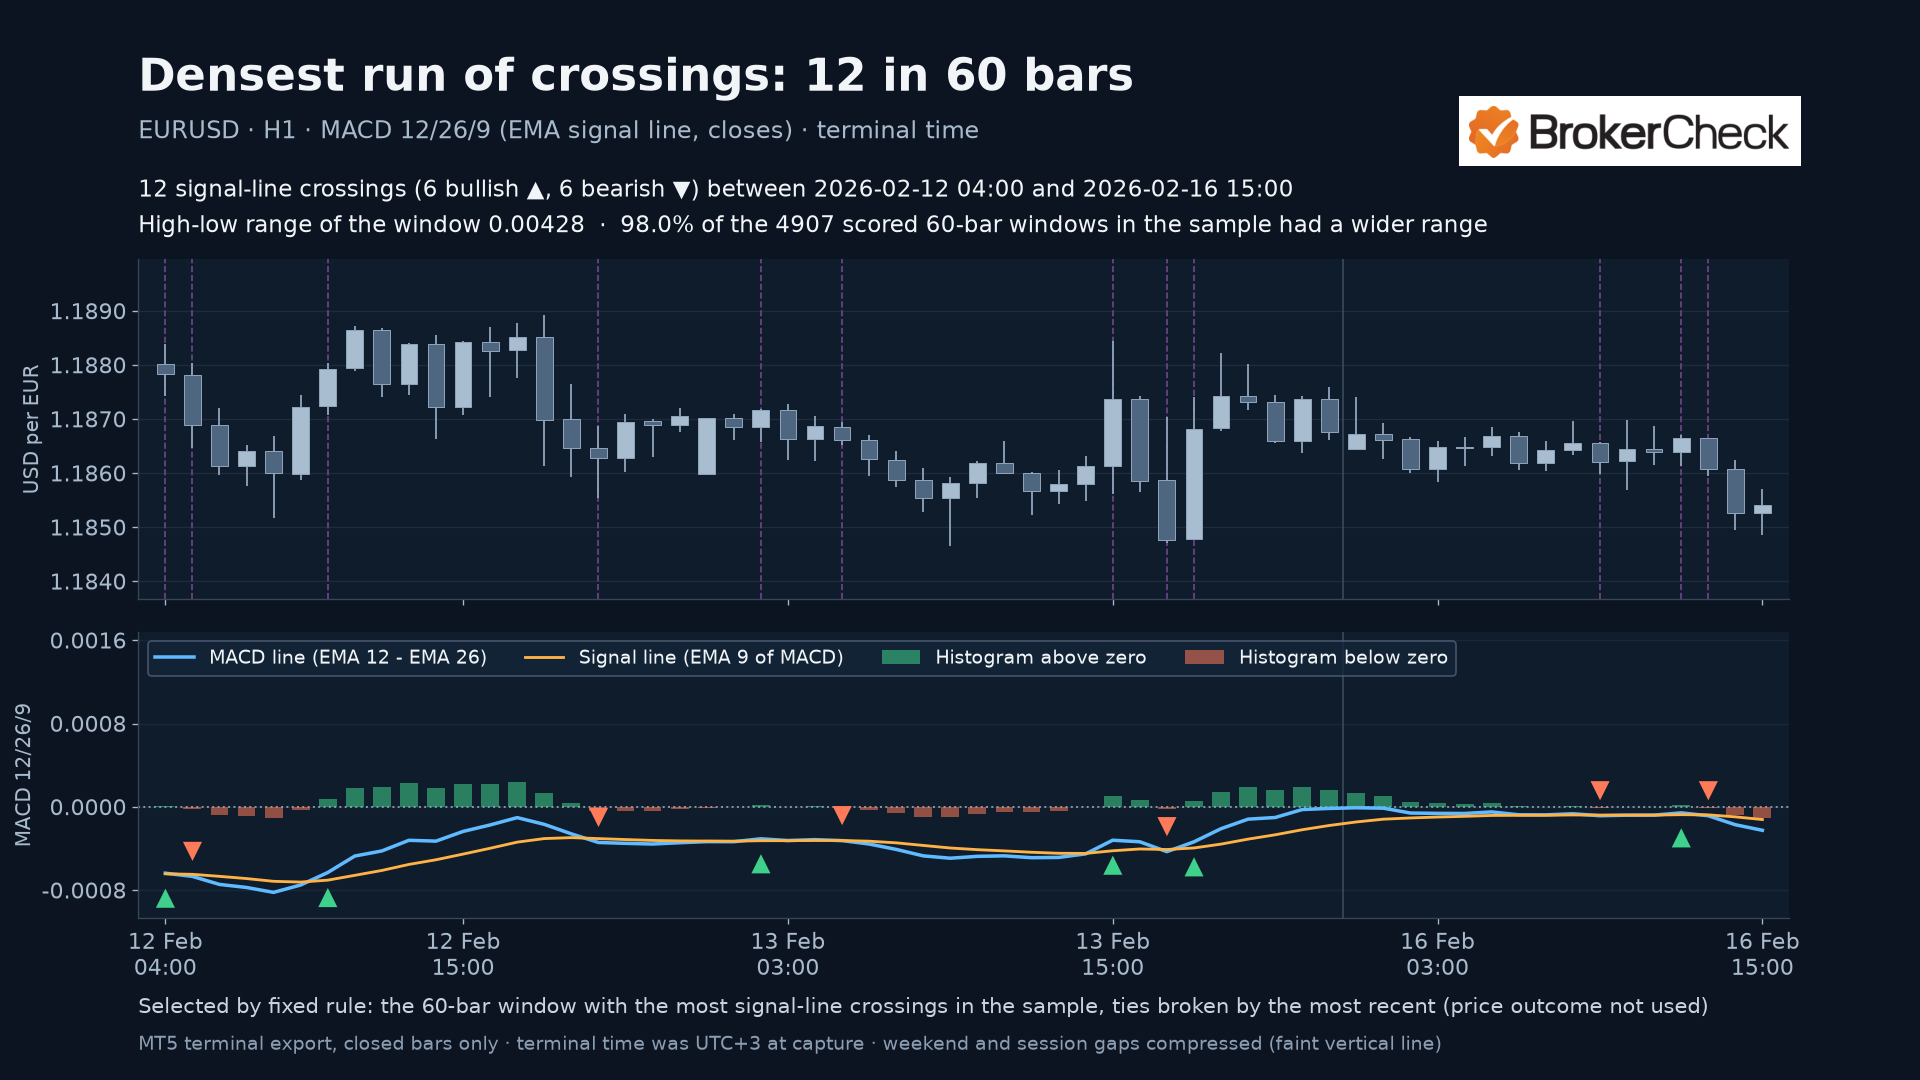
These charts use EURUSD hourly bars, with prices and MACD values in USD per EUR. The captured export contains 5,000 closed bars from 2025-12-04 15:00 to 2026-09-24 22:00. This is a historical sample, not a live quote.
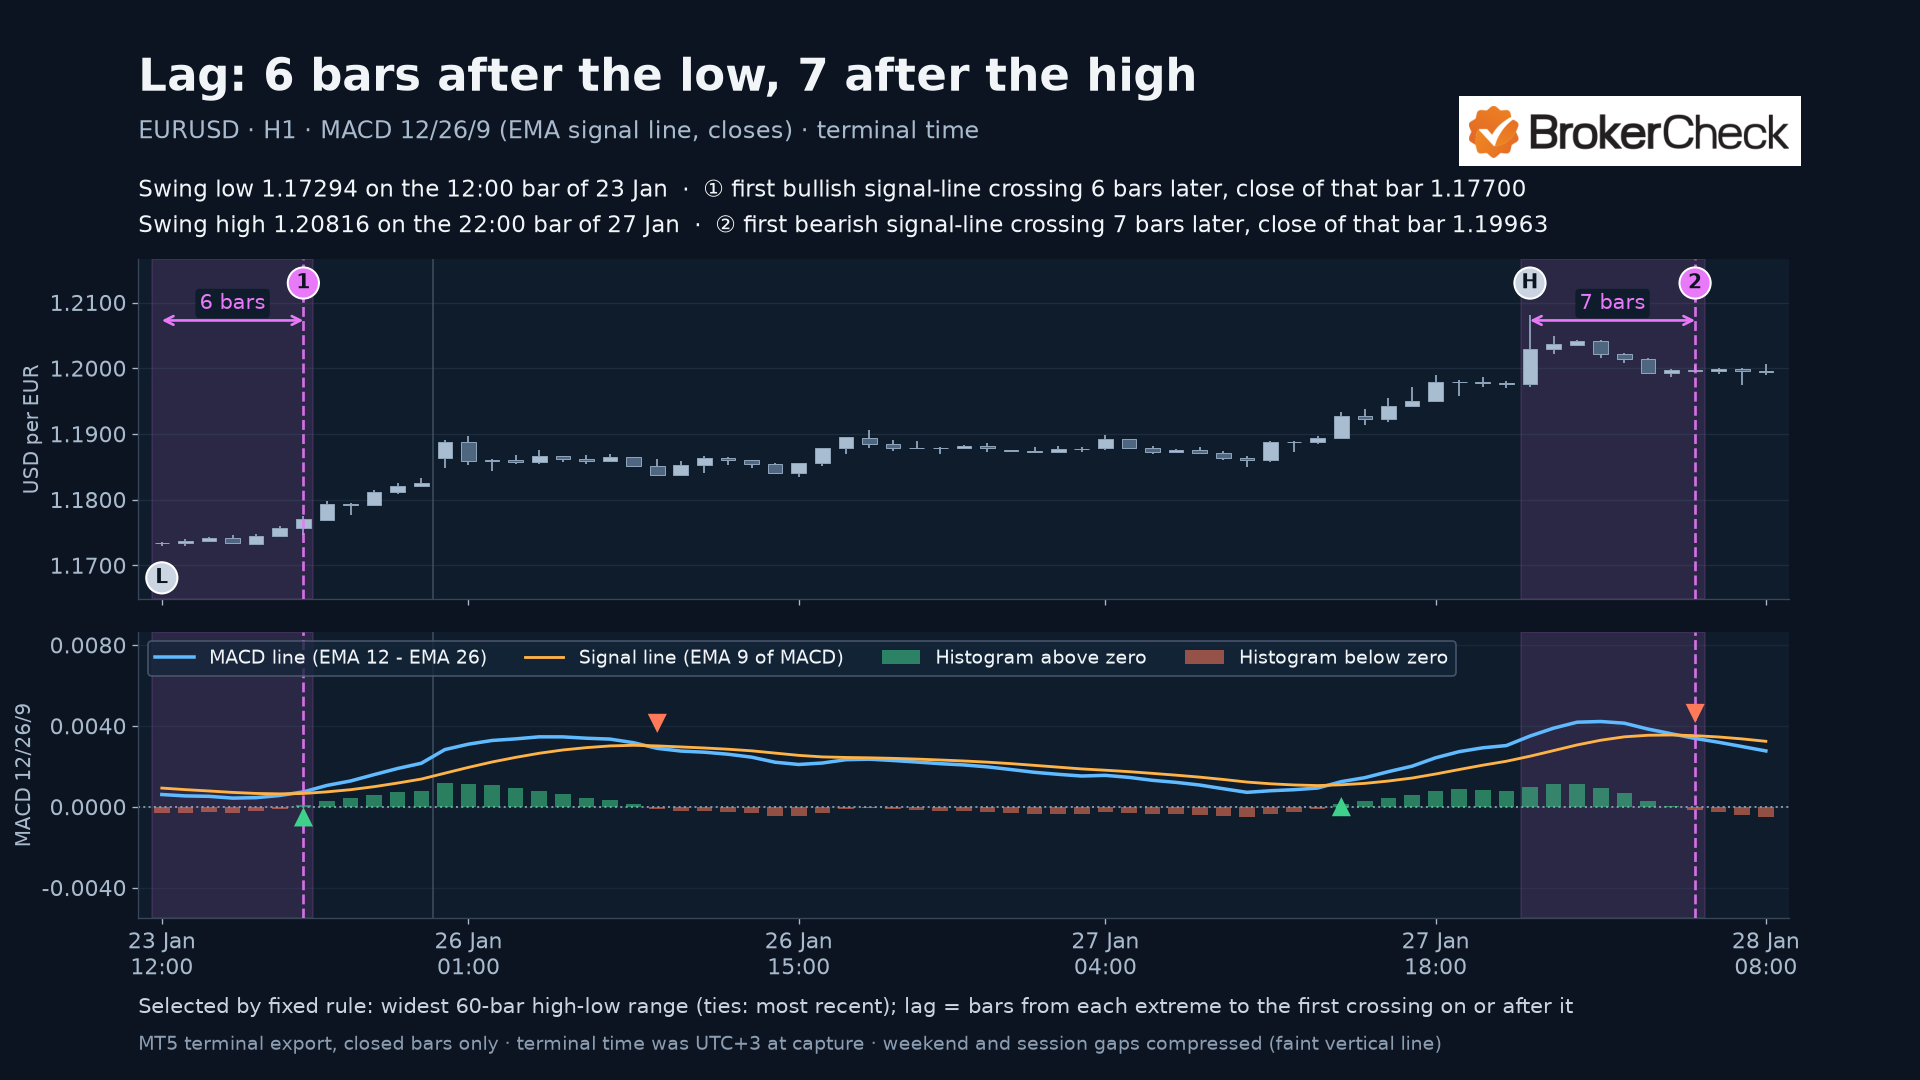
Chart times are terminal bar-open times. The measured terminal clock offset at capture was UTC+3; historical daylight-saving changes are not modelled. Weekend and session gaps are compressed, with a faint vertical line at gaps.
An overview of the recent sample
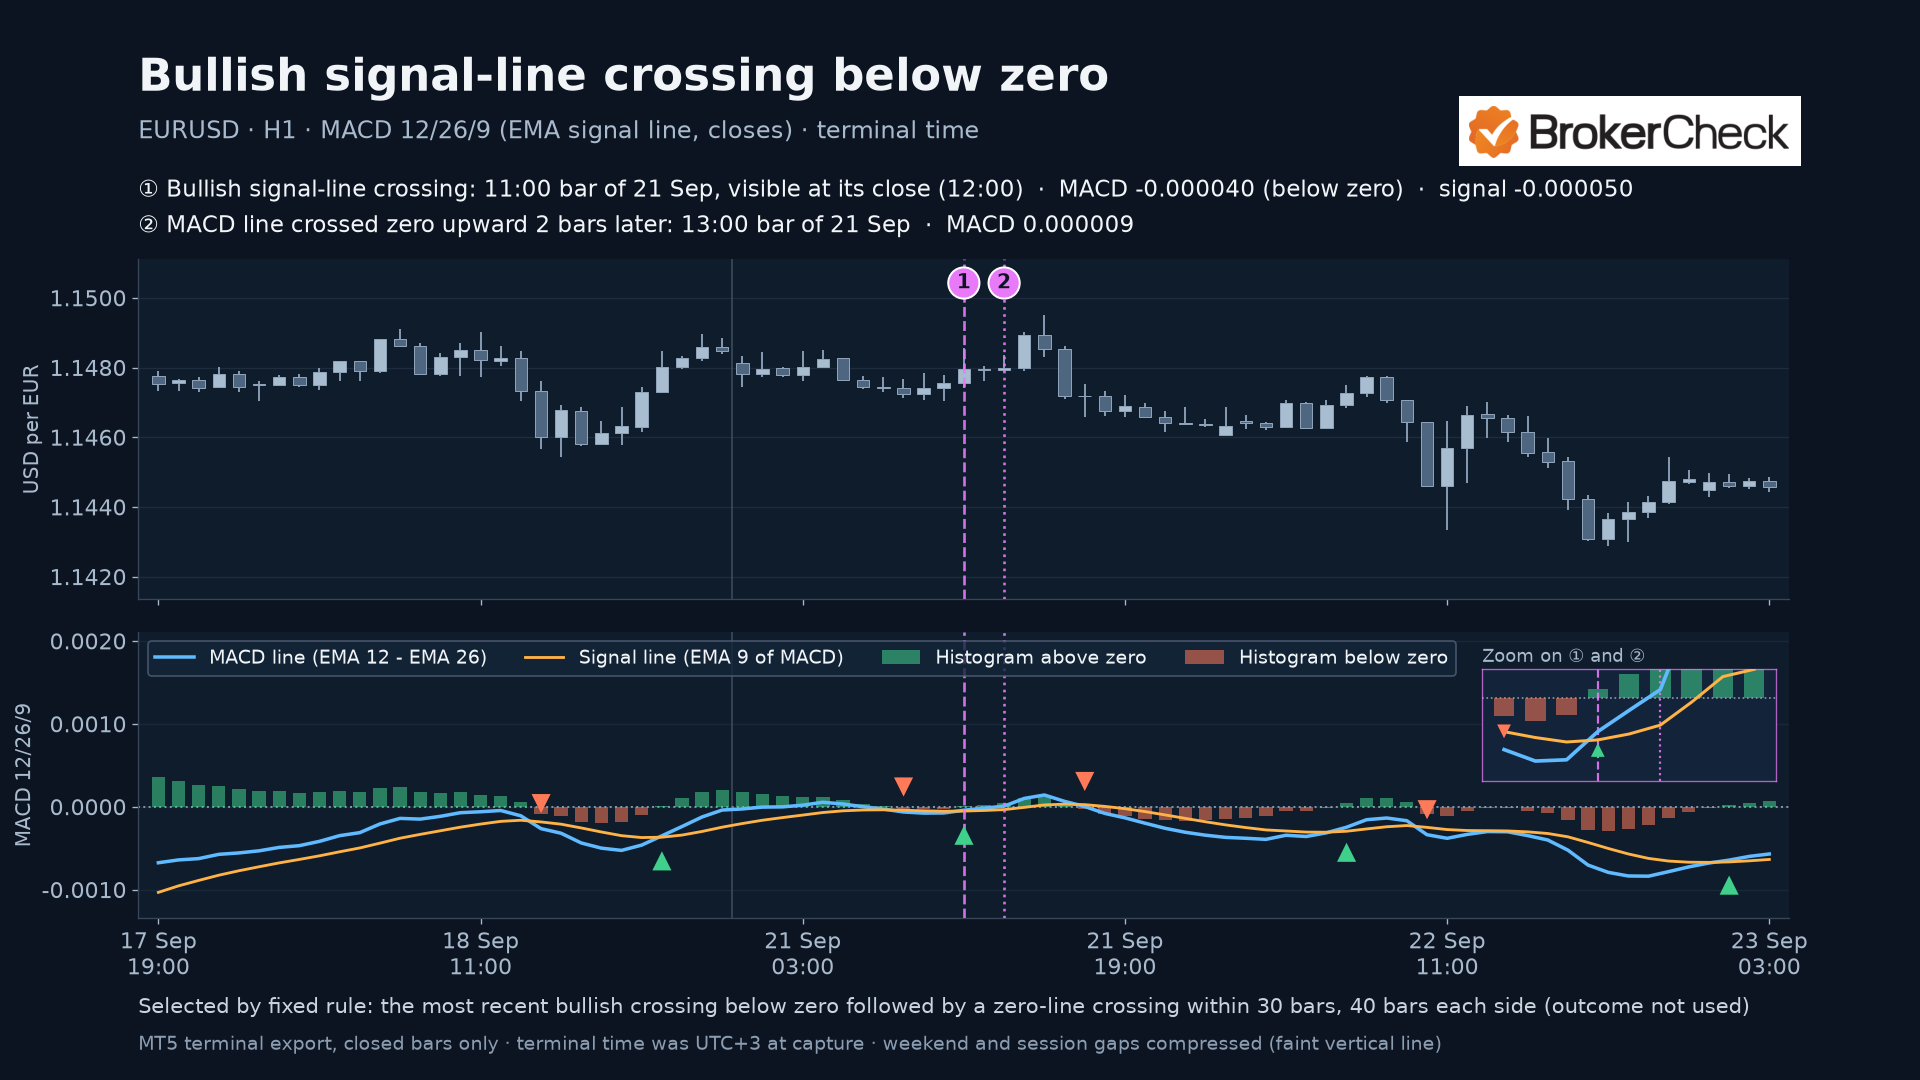
A bullish crossing below zero
A bearish crossing above zero
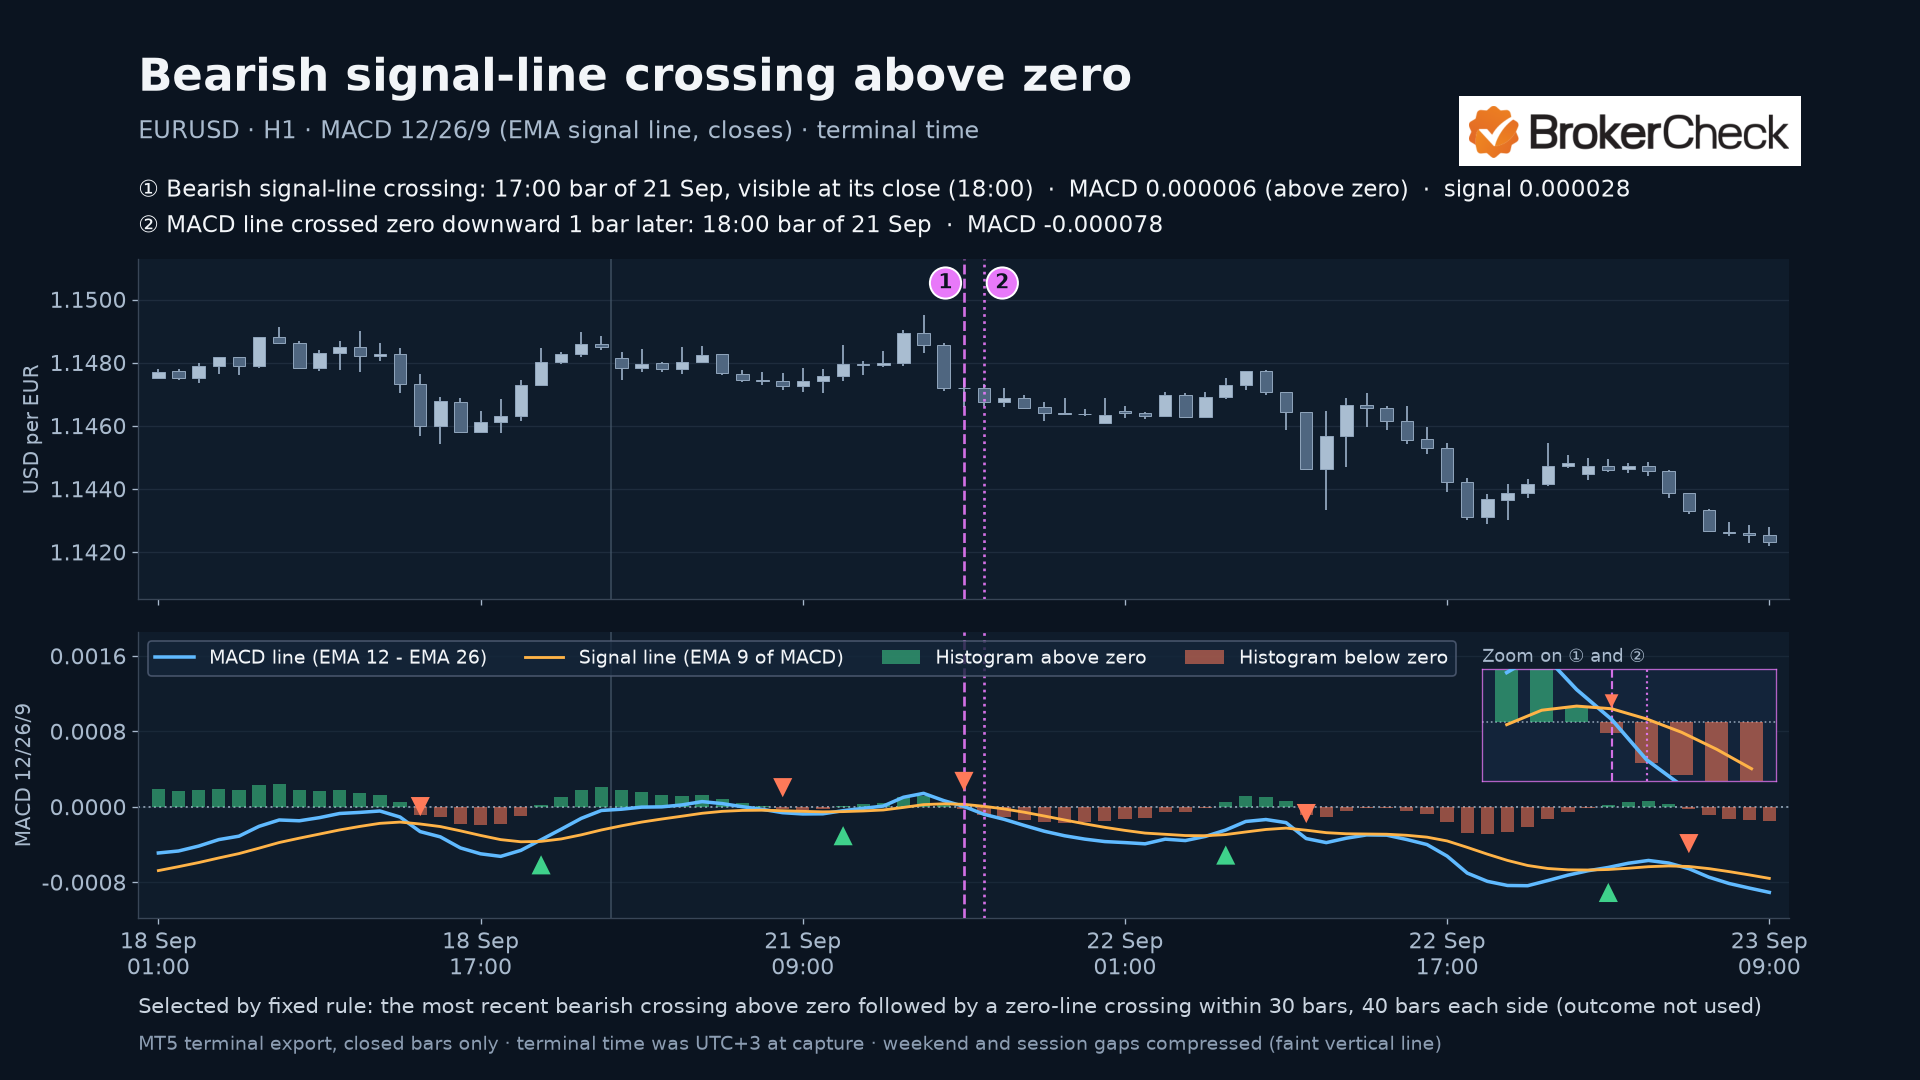
Each crossover example is the most recent qualifying crossing with 40 bars of context on either side and a subsequent zero-line crossing within 30 bars. Price outcome is not used to select it. The windows overlap by 75 bars; they show related events in the same part of the sample.
A dense run of crossings
Crossings after swing extremes
Download the indicator
The indicator runs in a separate window, displaying the MACD line, signal line, histogram and signal-line crossing arrows. It does not place trades, send alerts or use DLL imports.
Compiled MT5 indicator
The recorded compilation result is 0 errors, 0 warnings. Native chart attachment and drawing have not been tested.
Configuration
- Select the source or compiled file for the intended platform.
- Use the platform’s indicator folder and indicator controls to load a custom indicator.
- Set FastEma, SlowEma and SignalEma. FastEma and SignalEma must be positive; SlowEma must exceed FastEma.
- Check the signal-line convention, available history and closed-bar behavior before interpreting the display.
Limitations
This tool does not detect MACD divergence. It marks crossings and does not forecast prices or trade. Sample crossing counts are not hit rates and were not tested for trading performance. Other implementations can use different signal-line averages, seeds or first bars, changing their early values or signal line.
The sample counts are not hit rates and were not tested for trading performance.
Frequently asked questions
What does the MACD line measure?
It is the fast EMA of closing prices minus the slow EMA of closing prices.
What does the histogram show?
It is the MACD line minus the signal line. It is positive when MACD is above the signal line and negative when MACD is below it.
Which settings do the examples use?
The fast, slow and signal EMA periods are 12, 26 and 9 bars, respectively, applied to close prices.
Is a signal-line crossing the same as a zero-line crossing?
No. A signal-line crossing changes the sign of MACD minus signal. A zero-line crossing changes the sign of the MACD line itself.
Can the newest bar confirm a crossing?
No. The newest bar may still be forming. Its values change on each tick; this download reports crossing events only on closed bars.
Why can the built-in MetaTrader MACD look different?
The built-in indicator uses a simple-average signal line and draws the MACD line as a histogram. This download uses an EMA signal line and draws MACD minus signal as its histogram.
Does the download detect divergence?
No. This tool does not detect MACD divergence.
Further reading
- MACD calculation and display
- MACD indicator buffers
- Moving Average of Oscillator
- Moving average definitions
- Indicator recalculation events
- Historical bar retrieval
- Strategy tester calculation mode
- Exponentially weighted calculation reference
- Editor folders and structure
- Platform automated-trading controls
- Working with indicators