

Capital.com
- Minimum deposit
- $20
- Regulated by
- CySEC, FCA, ASIC
Explore indicator guides from BrokerCheck.
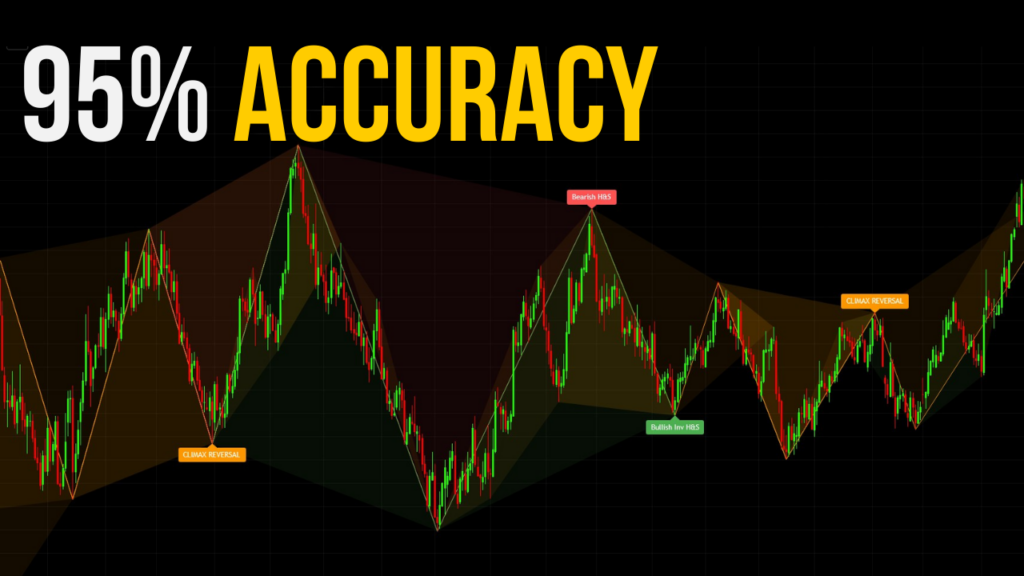
Why Most Divergence Indicators Fail Before understanding what makes the VDubus indicator different, it helps to understand what makes every other divergenc

1. What is the Knoxville Divergence Indicator? Knoxville Divergence is a technical analysis indicator used by traders to identify potential reversals in th

What is the Linear Regression Line Formula for Trading? The linear regression line formula is y = mx + b . In trading terms, this means: y = predicted pric
What is the Visible Range Volume Profile? Visible Range Volume Profile shows the amount of trading volume at each price level within your current chart vie






The Vdubus indicator uses confirmation lag, waiting for the full pattern structure to complete before drawing a signal. This means you enter after confirmation rather than at the exact turning point. Continue with the Vdubus divergence tutorial.
Knoxville Divergence looks for disagreement between price and momentum as a warning of a potential reversal. Its momentum component flags situations such as rising price with falling momentum, while the RSI component looks for extreme levels during that disagreement. Continue with the Knoxville Divergence guide.
The middle line of a Linear Regression Channel is the best-fit regression line through price data. The upper line acts as resistance and the lower line acts as support, with both sitting equal distances from the middle. The channel changes as new price data arrives. Continue with the Linear Regression Channel guide.
Visible Range Volume Profile shows trading volume at each price level within your current chart view, rather than volume over time. When you zoom or scroll, it recalculates the volume distribution for the visible range. Continue with the Visible Range Volume Profile guide.
KST smooths rate-of-change values from different time frames and combines them into one momentum indicator. Its calculation gives more weight to the longer time frames, and a moving average of KST forms the signal line. Continue with the KST indicator guide.
OBV adds trading volume to a cumulative total when the closing price rises and subtracts it when the closing price falls. If the closing price is unchanged from the previous day, OBV is unchanged too. Continue with the On Balance Volume guide.
Price Volume Trend combines price and volume data to assess trend strength and direction. A rising PVT line suggests bullish sentiment, while a falling line suggests bearish sentiment. PVT may be less reliable in thinly traded markets. Continue with the Price Volume Trend guide.
Cumulative Volume Delta measures the difference between cumulative buy volume and cumulative sell volume over a period. A positive CVD suggests stronger bullish sentiment, while a negative CVD suggests stronger bearish sentiment. Continue with the Cumulative Volume Delta guide.
A seasonality indicator identifies recurring patterns or trends during specific time periods. These patterns can be influenced by weather, holidays, economic events, or cultural practices. Understanding historical seasonal patterns can help you plan trades and adjust risk exposure. Continue with the seasonality indicator guide.

